Caution: Some people may find parts of this content confronting or distressing.
Suicide is the leading cause of death among Australians aged 15–24 (see Deaths in Australia). The proportion of deaths by suicide is relatively high among children and young people due to the fact that these age groups do not tend to die from other causes.
In 2020:
- 381 Australian young people (aged 18–24) took their own lives
- 99 deaths by suicide occurred among children and adolescents (aged 5–17) with the majority occurring in those aged 15–17 (74% in 2020)
- deaths by suicide represented 31% of all deaths in young people aged 15–17 and 39% of all deaths in those aged 18–24, up from about one-quarter (25%) of all deaths in these age groups in 2010. In children aged 14 and below, the proportion of deaths by suicide is low compared with the 2 older age groups; in 2020 deaths by suicide represented 12% of all deaths in this age group.
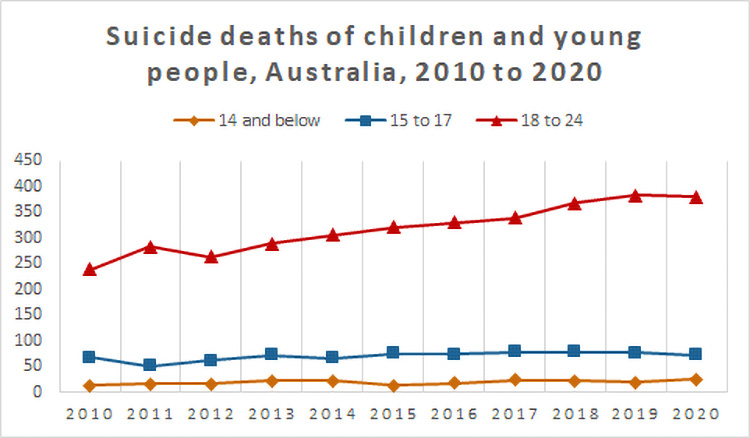
The line graph shows the age-specific number of deaths by suicide for children and young people aged 14 and below, 15–17 and 18–24 from 2010 to 2020. The highest rates of suicide across the period were for young people aged 18–24, which increased from 10.8 deaths per 100,000 population in 2010 to a high of 16.4 in 2020.
Throughout 2010 to 2020, age-specific suicide rates:
- were higher for young adults (aged 18–24) than adolescents (aged 15–17) and children (aged 14 and below)
- increased in young people aged 18–24 (from 10.8 deaths per 100,000 population in 2010 to 16.4 in 2020) while remaining relatively stable for those aged 15–17 (7.9 to 8.3 deaths per 100,000 population)
- ranged from 0.5 deaths per 100,000 population in 2010 to 0.8 in children aged 14 and below.
| Year | 14 and below | 15 to 17 | 18 to 24 |
|---|---|---|---|
| 2010 | 13 | 68 | 239 |
| 2011 | 16 | 51 | 284 |
| 2012 | 16 | 62 | 264 |
| 2013 | 22 | 73 | 289 |
| 2014 | 22 | 67 | 306 |
| 2015 | 13 | 76 | 322 |
| 2016 | 18 | 74 | 331 |
| 2017 | 24 | 78 | 340 |
| 2018 | 22 | 79 | 369 |
| 2019 | 19 | 77 | 384 |
| 2020 | 26 | 73 | 381 |