The problem of depression in Australia is reflected in the hard data on annual suicide and self harm rates. On average there were 2406 suicides per annum in the period 1990-2001 (the 10th biggest identified category of killer in the population as a whole).(5) This was 2454 in 2001, larger than road accident deaths at 1736.
The problem is actually much bigger than these raw numbers suggest. This is because suicide is heavily skewed towards youth, and young to middle-aged adults. The ABS calculates a statistic of Years of Potential Life Lost (YPLL). This recognises that the average life is around 75 years. If you die before 75 there are years of potential life that are lost.
Compare an 18 year old finishing the HSC certificate, with 57 years of average potential life to contribute to society, versus a 74 year old with 1 year of average potential life left.
These issues are reflected most strongly in the steeper deterioration of Years of Potential Life Lost for suicide versus the YPLL for all causes of premature death (see Figure 1).
In 1986 there were 1 million years of potential life lost through all causes of death (see Figure 2). Favourable trends in living standards and healthcare have seen this fall to just over 800,000 p.a. in 2001. Suicide on the other hand is responsible for 85,000 years of potential life lost in 2001, having risen from around 67,000 back in 1986. This is equal to 11% of age-adjusted deaths (see Figure 1).
The waste of young lives, often involving youth near the end of their education years, is massive in terms of the potential contributions to society that are lost.
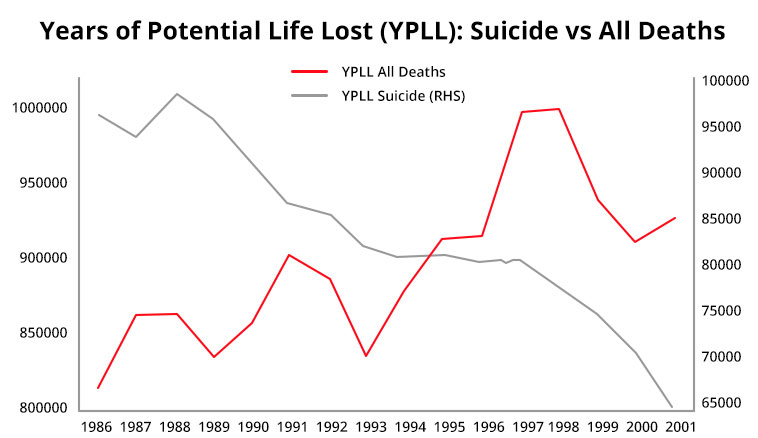
Source: Information Paper, Suicides 2001, & Suicides 1921-1998, ABS Cat. No. 3309.
Hospitalised Self Harm
The skew of hospitalised self-harm (and suicide) towards young people is shown in the distribution by age in Figure 2.
There were 25,120 people hospitalised for self harm in 1997/98, around 10 times as many as for suicides.
Hospitalised self-harm is even more skewed towards young people than is the case for suicides. Depression accelerates rapidly around adolescence.
These much larger numbers are indicative of depression and self esteem problems that go well beyond the suicide numbers. Self-harm starts strongly with adolescence and suicide seems to build into young middle age, before declining later in life.
This is one of the reasons that the Anika Foundation will attempt to support research into depression in young people, with the aim of helping them through the difficult school years, and to come to grips with depression at the point where it first emerges in adolescents.
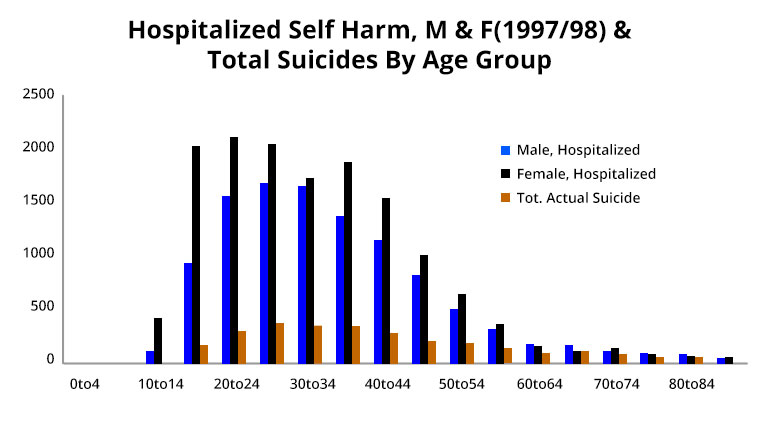
Source: "Suicides and Hospitalised Self Harm in Australia, M. Steenkamp & J. Harrison, Aust. Instit. Of Health & Welfare.
International Comparisons For Australia Are Dismal
A comparison of Australia's suicide rates with those of other countries is not flattering. Figure 3 shows Australia alongside the G7 Countries, and a number of other selected countries.
Australia has the 3rd highest suicide rate in the group.
Climate, social attitudes and religion are known factors. Australia's climate is on a par with Mediterranean countries like Italy, Spain and Greece, which all have very low (favourable) rates compared to Australia.
Australia has a better climate than the United Kingdom, and a similar Anglo Saxon dominated culture; yet the UK has half the suicide rate of Australia. Getting Australia's rate down towards UK levels should be an achievable goal over time!
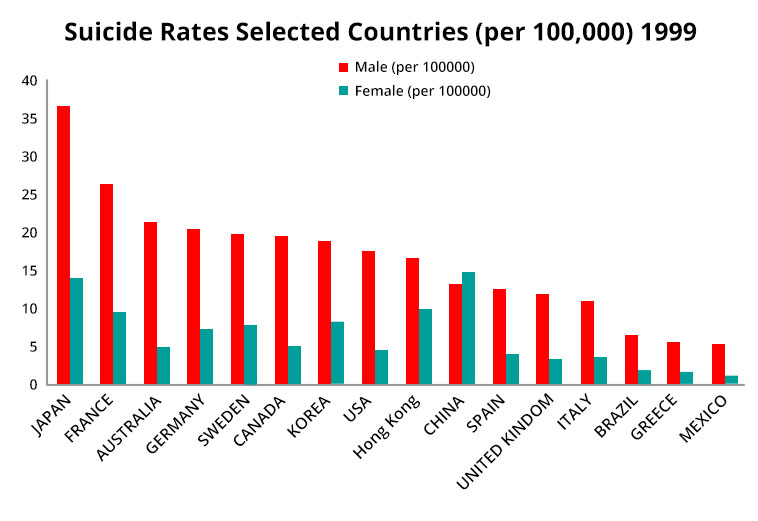
Source: United Nations, WHO.
(5) 'In 2001 there were 2454 suicides, out of 128544 total deaths (about 1.9%). Cancer, heart disease and stroke were the three largest contributors. But these disproportionately affect older people. Road accident deaths by way of comparison were 1736 in 2001. Source: 'Causes of Death in Australia', ABS Catalogue 3303.0 (02/12/03) and 'Year Book Australia', 2003 Road Traffic Accidents. ABS Catalogue 1301.0-2003.